From tree of life to web of life: How Google Images can help ecologists study evolution


Colour polymorphism – when a species has two or more colour types – has fascinated biologists since Darwin. The occurrence of these different colour types often varies geographically, providing a useful way of studying how different colour morphs – or phenotypes – evolve.
But the fieldwork needed to collect these data is time consuming and expensive, so Dr Arjun Amar and his student Gabriella Leighton from the University of Cape Town wondered if ecologists could use the thousands of animal images posted on the internet instead.
To discover whether or not these photographs could accurately substitute for fieldwork, they used Google Images to find photographs of four species – black bears in western North America, barn owls worldwide, black sparrowhawks in South Africa, and hooded or carrion crows in Europe.


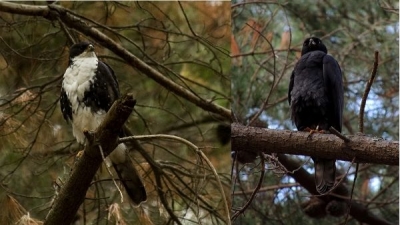
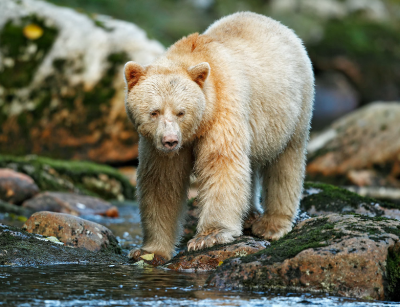
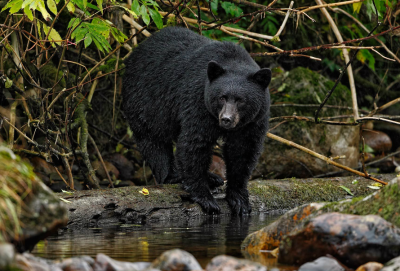
As well as black, the bears also occur as cream, cinnamon, chocolate brown or bicolour varieties. Barn owls vary from rusty red to pure white, while black sparrowhawks are either completely dark or have a white breast.
Once considered subspecies, black and grey hooded crows and all black carrion crows are now thought to be two separate species with a narrow, clear-cut hybrid zone where the two meet and interbreed. In the UK, this zone runs straight through Inverness, where hooded crows occur to the north of the city and carrion crows to the south.
“We selected these species because accurate scientific data already exists on the distribution of their different colour morphs, allowing us to compare and assess the accuracy of our new method based on Google Images,” Dr Amar explains.
Based on more than 4,800 Google Images pictures of the four species, the results prove that this method can produce results that are as accurate as fieldwork.
While anyone could do this, handling and scoring so many images is logistically challenging. So the ecologists teamed up with computer scientist Pierre Hugo who developed a new web application called Morphic, which allows the data to be collected more efficiently.
According to Leighton, lead author of the paper: “Very pleasingly, the method worked: we were able to create a map of the different colour varieties and, most importantly, the pattern of this map matched very well the known pattern of the colour varieties. And whereas our data took only days or weeks to collate from my office, these other data had often taken years of labour intensive fieldwork or visits to museums worldwide.”
The new technique opens up a world wide web of possibilities for ecologists, from migration and diet to birds' moulting patterns and the age structures of animal populations in different areas. It works best for species that are of interest to photographers, so are very well photographed, as well as easy to recognise and categorise.
Dr Amar is already using it to study the colour patterns of other species, including common buzzards and tawny owl morphs in Europe, Swainson's hawks in North America and augur buzzards across East Africa.
“When we describe our method, other researchers always come up with different ideas for their own study system, so we hope they will use it to answer questions of their own that we haven't even imagined. We have made the web application freely available and can’t wait to see what others come up with,” he says.
And if more photographers geo-tag their images with location and dates, their pictures could be even more valuable for ecology in future.
“Although not part of this study, in future this approach might allow us to explore how phenotypes change over time. We know that phenotypes are often linked to specific weather conditions, for example more dark morphs occur in wetter areas. Thus, with climate change occurring there are many predictions suggesting that occurrence of the different colour morphs might also change, and our new technique might allow this to be investigated,” Dr Amar says.
