The kinematic and residence time data from the motion of a tracer particle can offer insight into the efficiency of industrial processes and provide experimental data to validate fundamentally based models. Recent applications that have benefited from PEPT measurements at PEPT Cape Town include mineral processing, petroleum geology, and mixing. We investigate the fundamental behaviour of dynamic processes, and often make measurements of systems with harsh conditions such as high pressures, temperatures, shear rates, and dense multiphase slurries.
Example Application: Rolling drums
The undergraduate third year physics class at UCT completes a project with PEPT every year. The students typically invest in theoretical modelling and simulation of the system under study, undertake a measurement campaign at the laboratories of PEPT Cape Town, and undergo detailed data analysis to investigate the phenomena of interest. In 2018 and 2019, the students studied granular motion in a rolling drum which was composted of a bi-disperse mixture of 3 mm and 5 mm diameter glass spheres moving in a rotating cylinder.

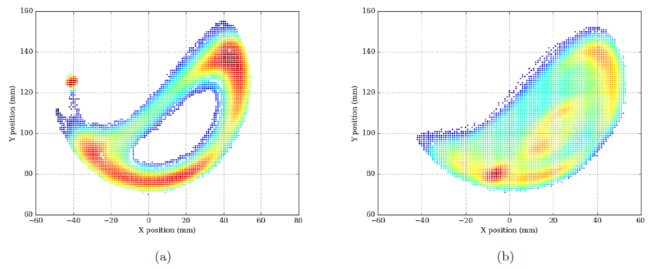
The plots below show tracer occupancy (as frequency scatter plot of XY position) with 1 mm2 bins for (a) 5 mm and (b) 3 mm particles in a rotating cylinder, with red indicating highest occupancy. Using such data it is possible to determine residence time distributions, a dynamic density profile, and investigate mixing, segregation, and transport effects such as convection.

As PEPT is a dynamic technique it is possible to measure the time differential of the tracer particle trajectory to gain access to the underlying velocity fields. Here is an overlay of multiple measurements of a rotating system in the steady state where each data point is coloured by the absolute speed of the particle at that instant.

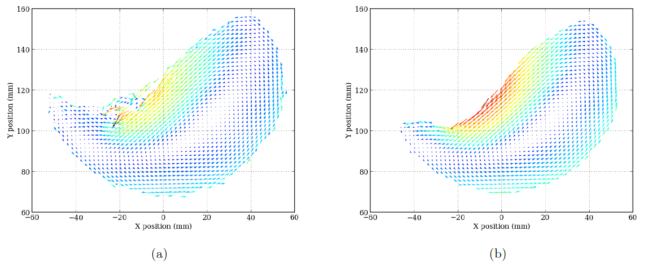
PEPT measurements can also produce average velocity field plots, as shown below for (a) 3 mm and (b) 5 mm tracer particles in a rotating cylinder. The vectors are colour coded by magnitude, with red indicating highest velocity.

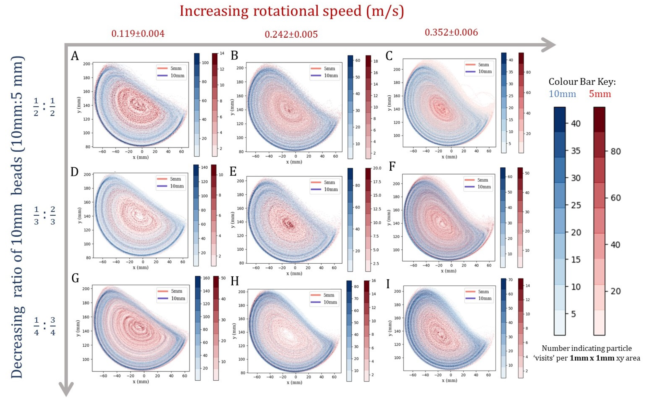
With a detailed experimental campaign multiple experimental parameters can be investigated and the operational phase diagram for such a system can be observed. The plot below demonstrates the impact of changing the ratio of large to small glass beads, and how changing the rotational speed of the drum affects both the angle of repose and the degree of particle species segregation.
